EFEX (Farhad Exchange) Group has launched a Telegram bot, and users of the Pro EFEX (Farhad Exchange) website can receive Elliott charts of their desired cryptocurrency pairs by registering in this bot and deciding to trade based on it.
Telegram Bot Address
@FexAnalysisBot


* Please note that only authenticated users on the Pro EFEX (Farhad Exchange) website can use this bot.
* It is worth mentioning that the provided analyzes are only educational, and EFEX (Farhad Exchange) Group has no responsibility for them, so the risk of using the analysis rests with the respected users.
There are two methods of analyzing capital markets: technical and fundamental. Fundamental analysis studies economic, political, and financial factors and, in general, all factors affect a stock.
Technical analysis is also the prediction of the price of a share, with the help of charts and mathematical relationships, which is done based on examining the past price fluctuations of the same stake.
There are various tools for technical analysis, and the Elliott Wave Theory (Elwave software) is one of the most effective, acceptable, and widely used tools.
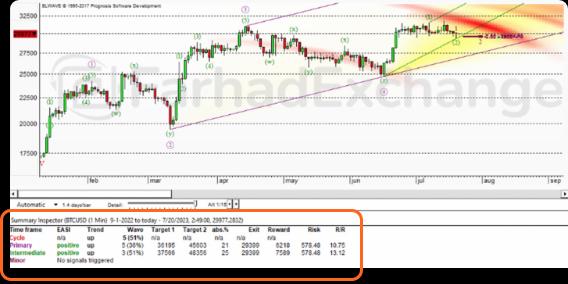
At the bottom of the chart is a window called SUMMARY INSPECTORwhich is one of the essential windows in this software regarding its data.
The data in this column show us a summary of different alternatives.
One of the necessary points in opening a trading position is that our various alternatives have announced the same result, which means that according to the other options, we can conclude that the trend is up or down.
How to read Elliott charts